[Python] Datapane을 이용한 보고서 작성
21 Sep 2022들어가며
회사에서 Python을 활용한 보고서 작성 프로그램을 만들어야 했다. 파이썬의 여러가지 라이브러리를 비교한 결과, Datapane이라는 라이브러리를 쓰기로 결정하였다. 이런 작업을 하는 것을 처음이라 여기저기 알아봤는데, Datapane에 대해 소개해주는 곳이 많이 없었다. 그래서 Datapane을 소개하기 위해 글을 작성하였다. 이번 포스트에서는 Datapane 라이브러리를 테스트하고, 사용법을 정리해 보도록 하겠다.
1. Datapane이란
Datapane은 interactive한 report를 쉽게 작성할 수 있는 파이썬 라이브러리이다.
위와 같이 chart 및 table 등을 조합하여 report html 파일을 작성할 수 있다.
2. Datapane 설치 및 테스트
먼저 Datapane을 설치하자. pip를 이용해 쉽게 설치할 수 있다. 2022/09/21 현재 Datapane 최신 버전인 0.15.1에 약간 문제가 있어 0.14.0 버전을 설치하였다.
pip install datapane==0.14.0
잘 설치됐는지 확인해보자.
import datapane
datapane.__version__

'0.14.0'
기본적으로 Datapane에서는 기존 Object들을 Wrapper 클래스로 둘러싸고, 마지막에 Report 클래스로 요소들을 종합하는 형식으로 활용한다. 아래 예시는 간단한 텍스트를 포함한 Report를 작성하는 코드이다.
import datapane as dp

text = dp.Text("Hello, World!")
report = dp.Report(text)
report.save("hello.html")
※ 2022/10/25 수정
현재 Datapane 0.15 버전에서는 리포트 생성 시 dp.Report가 아닌 dp.App을 사용
위 코드를 실행하면 hello.html 이라는 파일이 생성된다.
3. Datapane Block
Datapane에서는 Python Object들을 감싸는 Wrapper 클래스를 Block이라고 부른다. Report는 여러 Block들의 조합으로 구성할 수 있다. 여기에서 프로젝트를 할 때 사용한 블록 종류들만 간단하게 몇몇 개만 살펴보도록 하겠다.
- Text Block
위 예시에서 사용한 것이 Text Block이다. 단순 String 만이 아닌, md 파일 형식과 같은 Multi-line Text도 Block으로 만들 수 있다.
import datapane as dp

md = """
안녕하세요. 반갑습니다. *강조*

# 제목

- 요소

"""

report = dp.Report(dp.Text(md))
report.save("multi-line.html")

위와 같이 md 파일 형식을 쓸 수 있다.
- HTML Block
그러나 Text 만으로는 상세한 Styling을 하기 어렵다. 그렇기 때문에 Datapane에서는 HTML 파일 형식의 Block을 지원한다.
import datapane as dp

html_text="""
    <html>
        <!-- Styling elements of the page -->
        <style type='text/css'>
            #container {
                background: #000000;
                padding: 2em;
                margin-top: -25px;
            }
            h1 {
                color:#ffabf0;
                text-align:left;
                font-size:30px;
                font-family:verdana;
            }
        </style>
        <div id="container">
            <h1> Hello, World! </h1>
        </div>
    </html>
"""

report = dp.Report(dp.HTML(html_text))
report.save("html-test.html")

위와 같이 배경, 정렬, 폰트, 글자색 등을 자유롭게 설정할 수 있다.
그러나 저것만 사용하기에는 뭔가 아쉽다. Plain HTML 파일만 사용하면 HTML 안의 내용을 바꾸기 어렵다. HTML 파일 안의 내용을 바꾸기 위해 jinja2 라이브러리를 사용해보자. jinja2는 HTML 파일에 변수들을 쉽게 집어넣을 수 있는 라이브러리이다. 변수 내용을 집어넣기 위해 변수명을 로 둘러 쌓는다.
import datapane as dp
from jinja2 import Environment

html_text="""
    <html>
        <!-- Styling elements of the page -->
        <style type='text/css'>
            #container {
                background: #000000;
                padding: 2em;
                margin-top: -25px;
            }
            h1 {
                color:#ffabf0;
                text-align:left;
                font-size:30px;
                font-family:verdana;
            }
        </style>
        <div id="container">
            <h1> `{`{ input_text `}`} </h1>
        </div>
    </html>
"""

env = Environment()
text = "jinja2 test"
template = env.from_string(html_text)
html = template.render(input_text=text)
res = dp.HTML(html)
report = dp.Report(res)
report.save("jinja2-test.html")
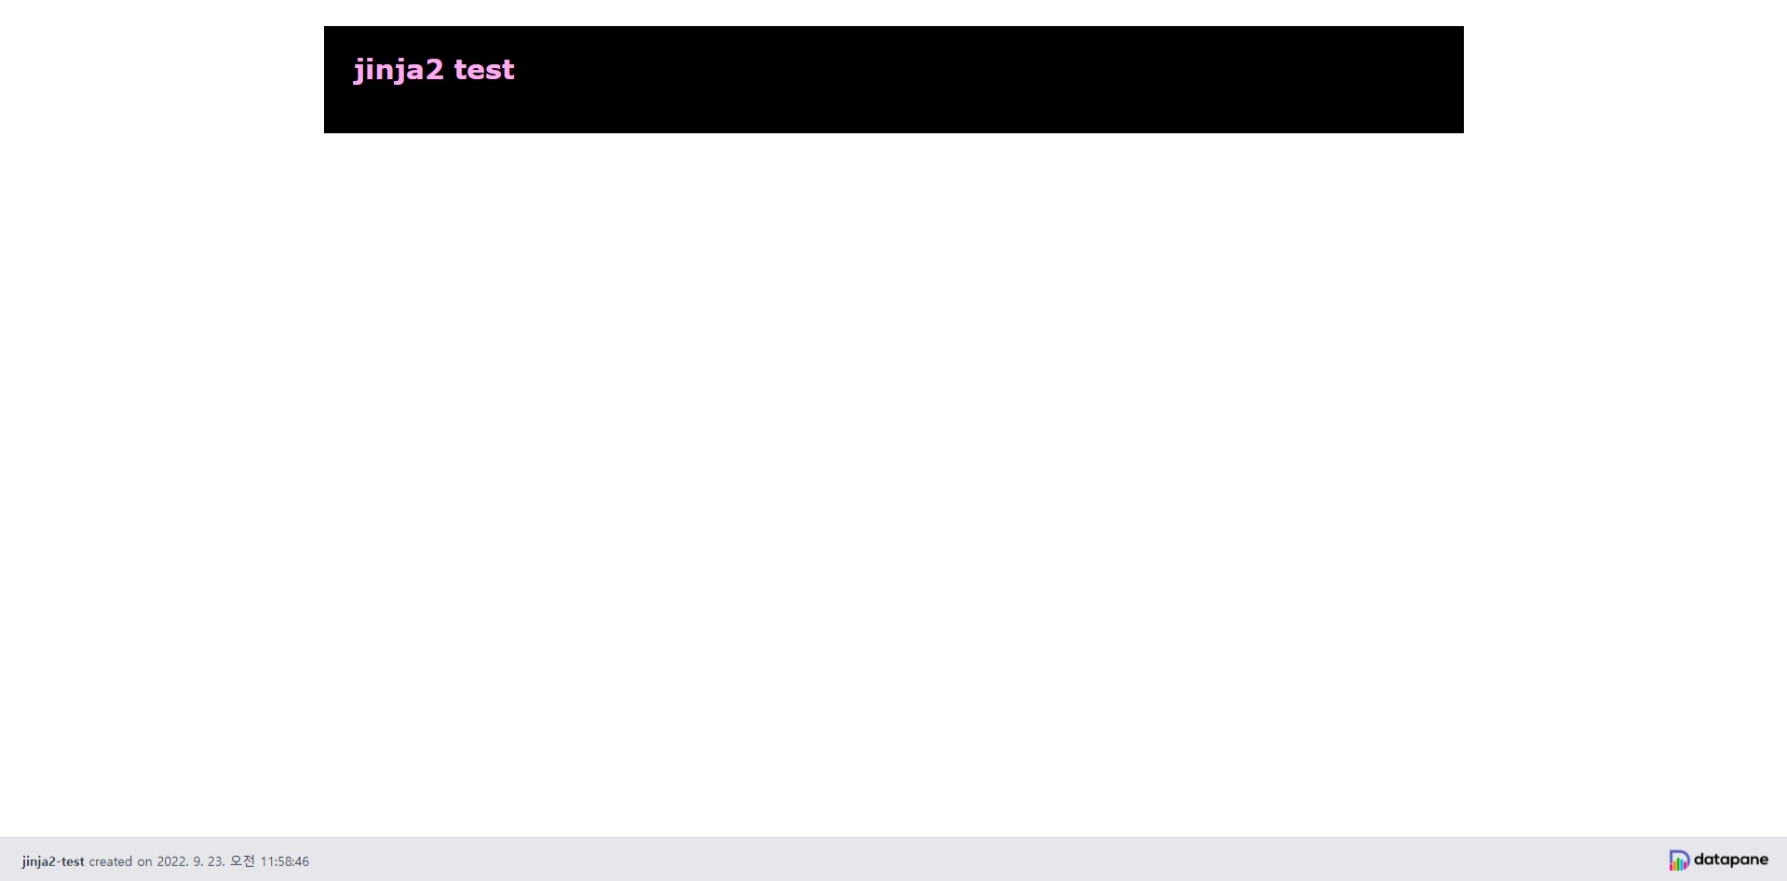
위와 같이 HTML 파일에 변수 내용이 들어가고, 그 HTML 파일을 바탕으로 HTML Block이 생성된 것을 확인할 수 있다.
- Table Block
Datapane에서 Pandas Dataframe Block을 만들기 쉽다. 그냥 Table Block에 Dataframe을 넣어주면 된다.
import datapane as dp
import pandas as pd

df = pd.DataFrame(
                {
                    "col1": [1,2,3],
                    "col2": [4,5,6]
                })

df_block = dp.Table(df)
report = dp.Report(df_block)
report.save("table-test.html")
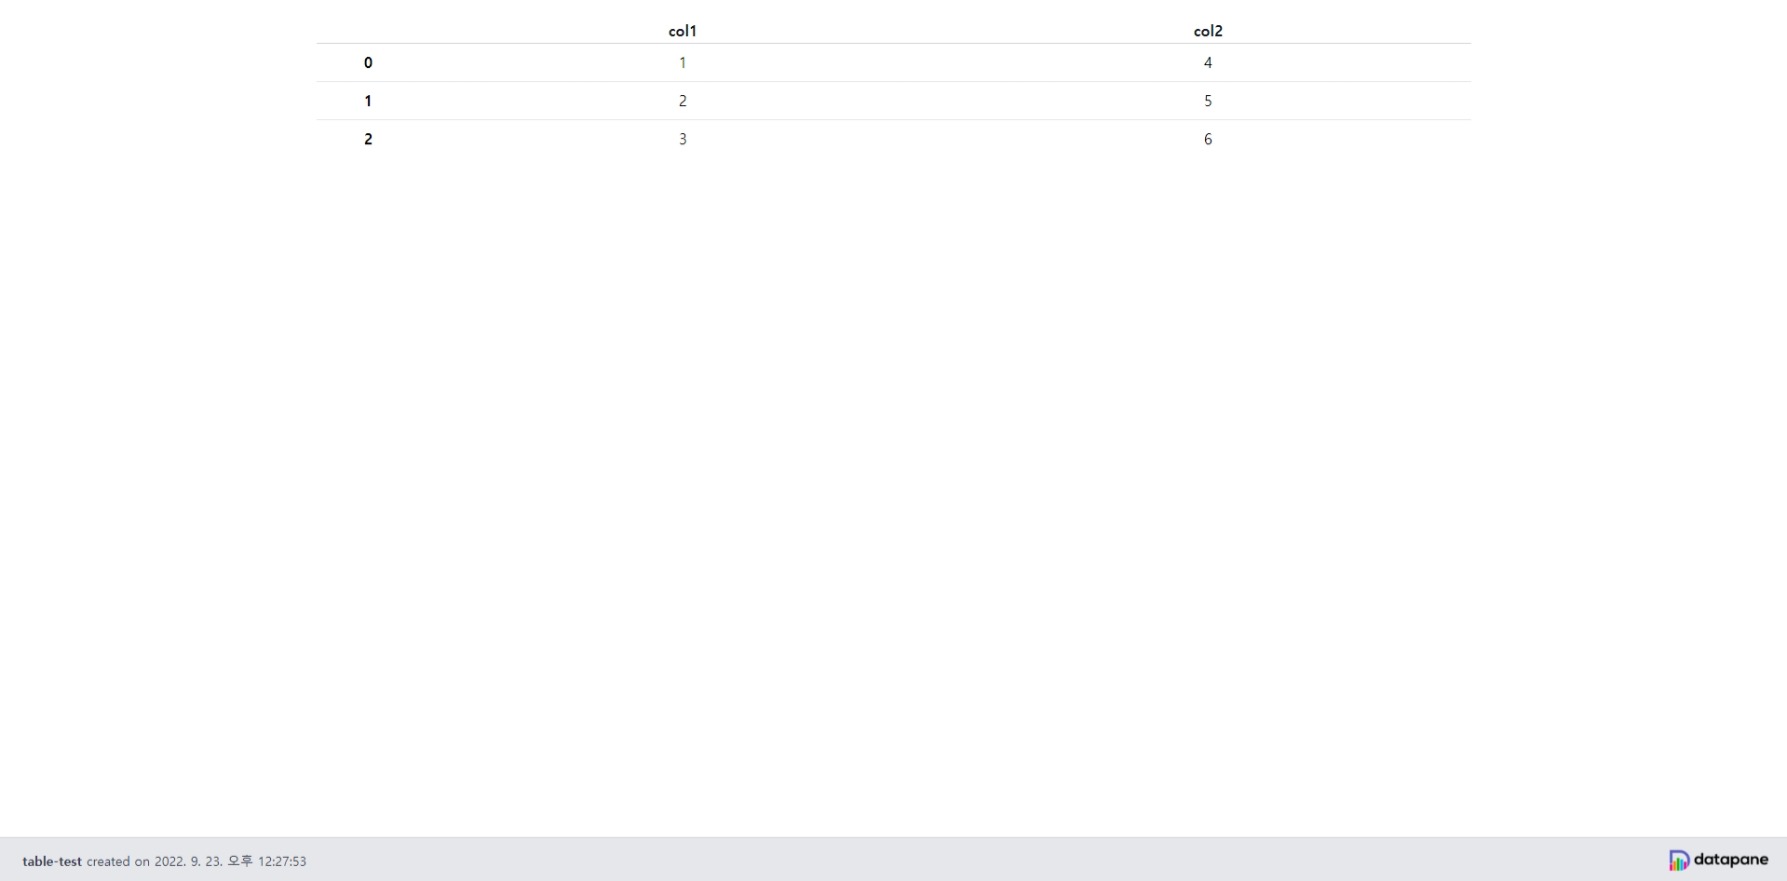
위와 같이 Table Block을 생성했을 때 Table이 잘 출력되는 것을 확인할 수 있다.
- Plot Table
Datapane에 Matplotlib, Altair와 같은 시각화 라이브러리도 쓸 수 있다. 나는 프로젝트를 할 때 여러가지를 고려해서 Altair를 선택했다. Altair를 선택한 이유는 추후에 포스트하도록 하겠다. 각자 자기 상황에 맞는 라이브러리를 사용하면 된다.
Plot을 넣을 때는 어느 라이브러리든 차트를 그리는 도화지를 dp.Plot 클래스에 넣으면 된다. 그래프 예시는 Altair Line Chart 예시를 사용하였다.
import datapane as dp
import altair as alt
from vega_datasets import data

source = data.stocks()

base = alt.Chart(source).properties()

line = base.mark_line().encode(
    x='date',
    y='price',
    color='symbol'
)

rule = base.mark_rule().encode(
    y='average(price)',
    color='symbol',
    size=alt.value(2)
)

plot = line+rule

report = dp.Report(dp.Plot(plot))
report.save("plot-test.html")
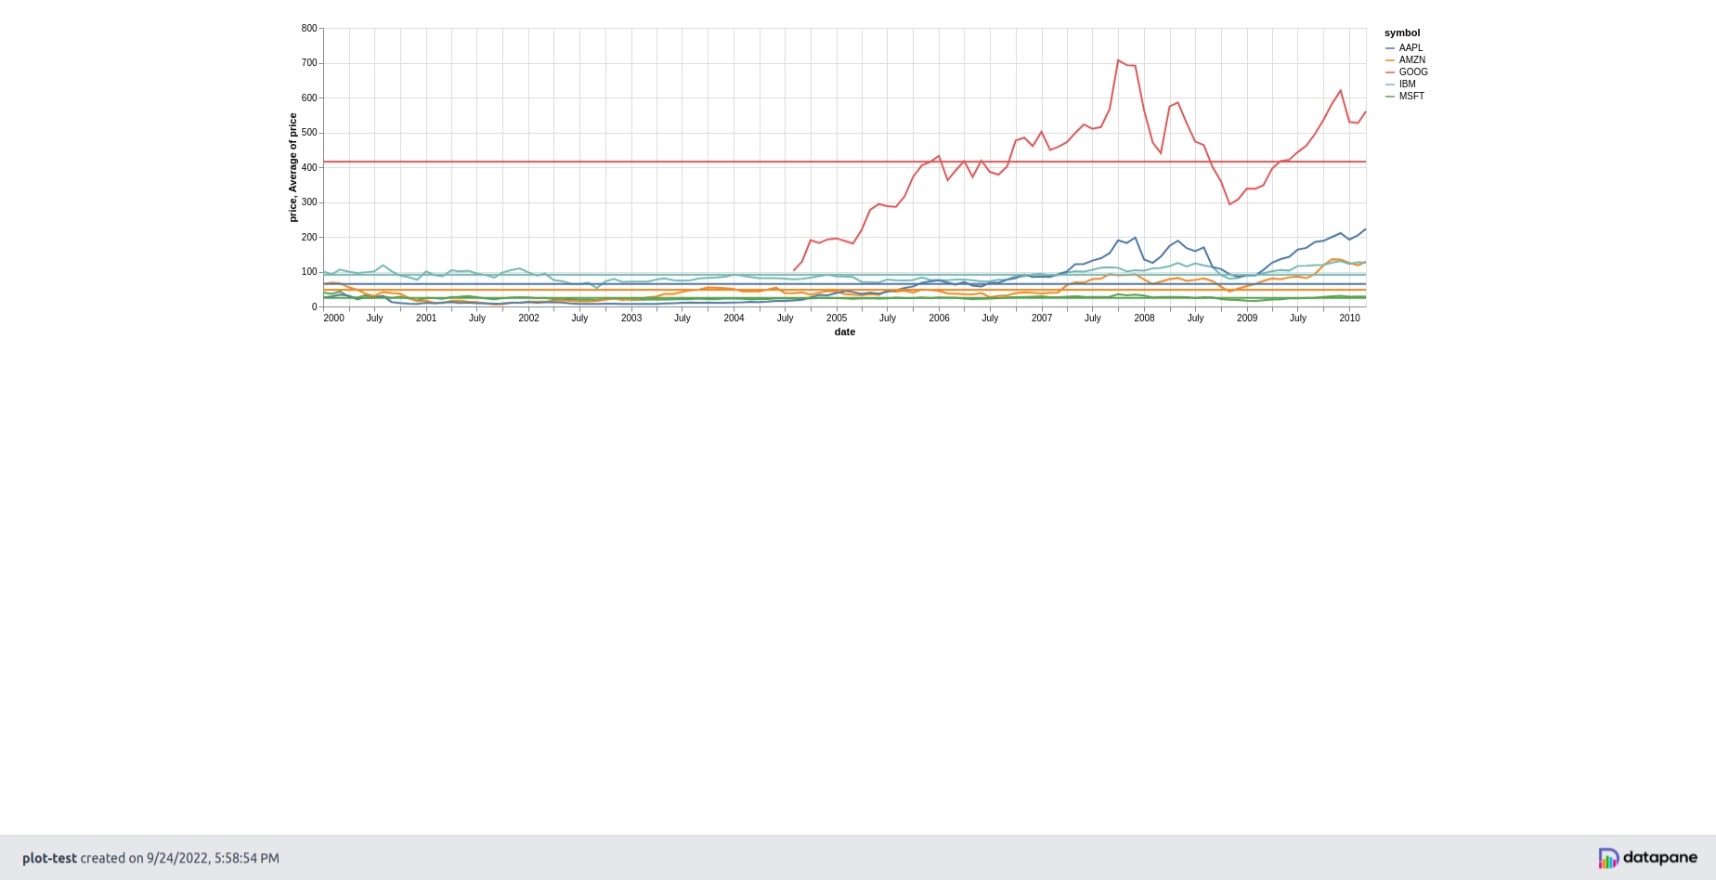
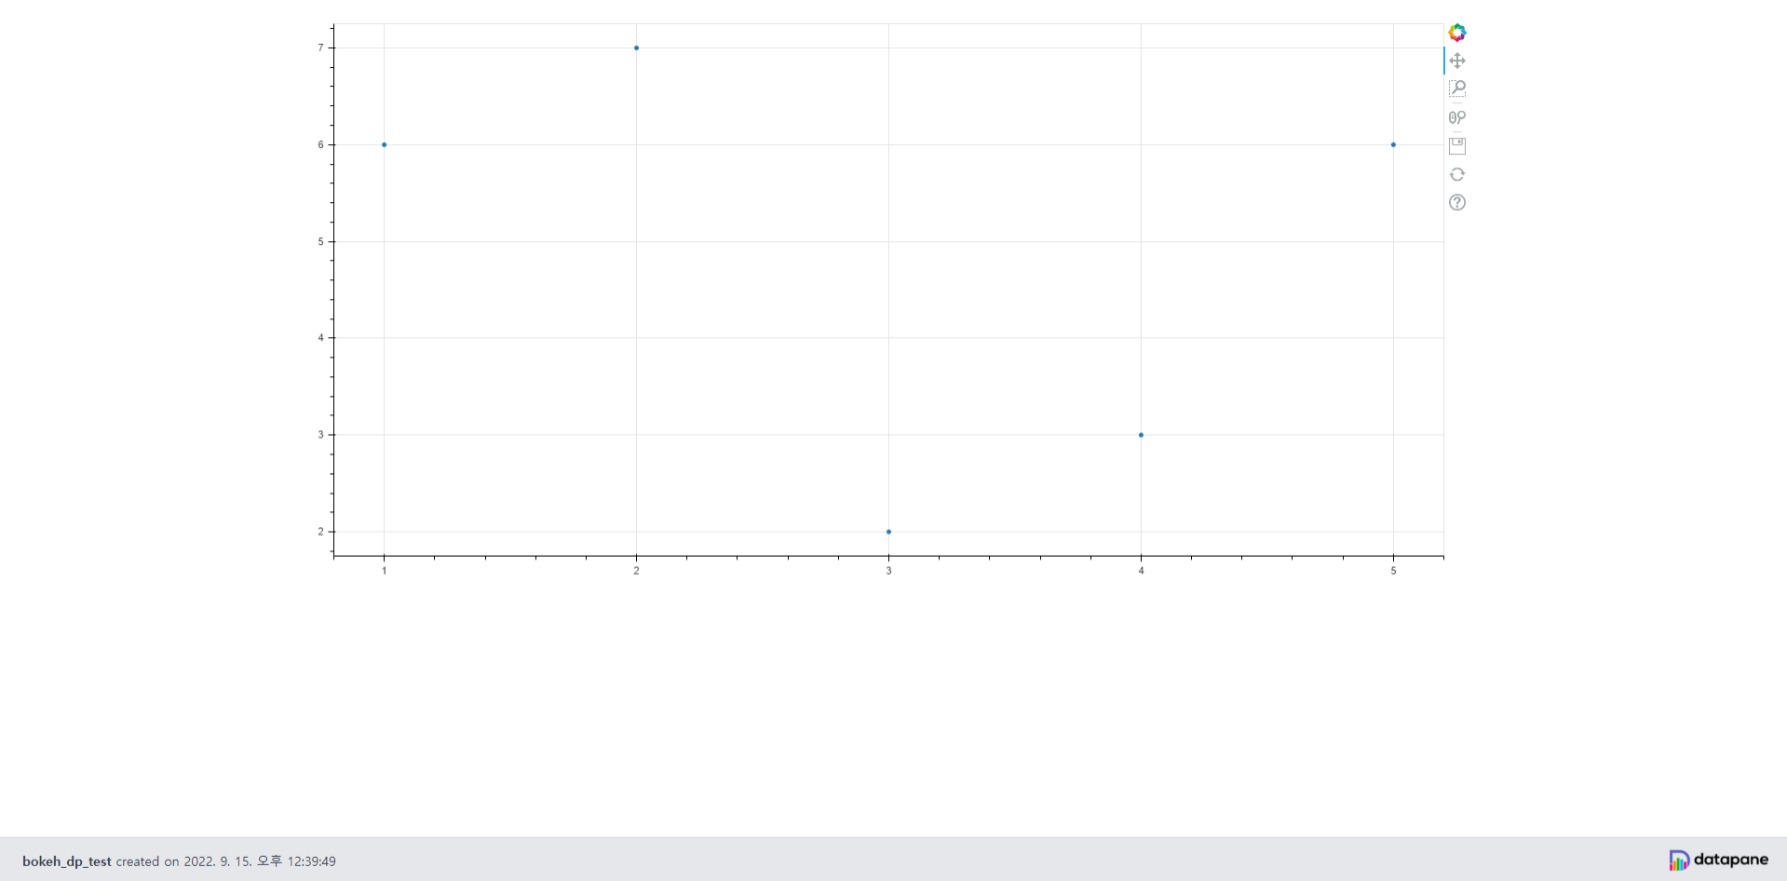
위와 같이 Report에 Plot을 삽입할 수 있다.
기본적으로 Datapane Plot에서는 Block 크기에 맞춰 Plot 크기를 자동으로 조절해준다. 그러나 Report에 들어가는 Plot의 크기를 조절하고 싶을 때가 있다. 그럴 경우 먼저 생성한 도화지의 크기를 설정하고, dp.Plot의 responsive 옵션을 False로 설정하면 된다. 기본값은 True이다.
...

report = dp.Report(dp.Plot(plot, responsive=False))
report.save("plot-test2.html")
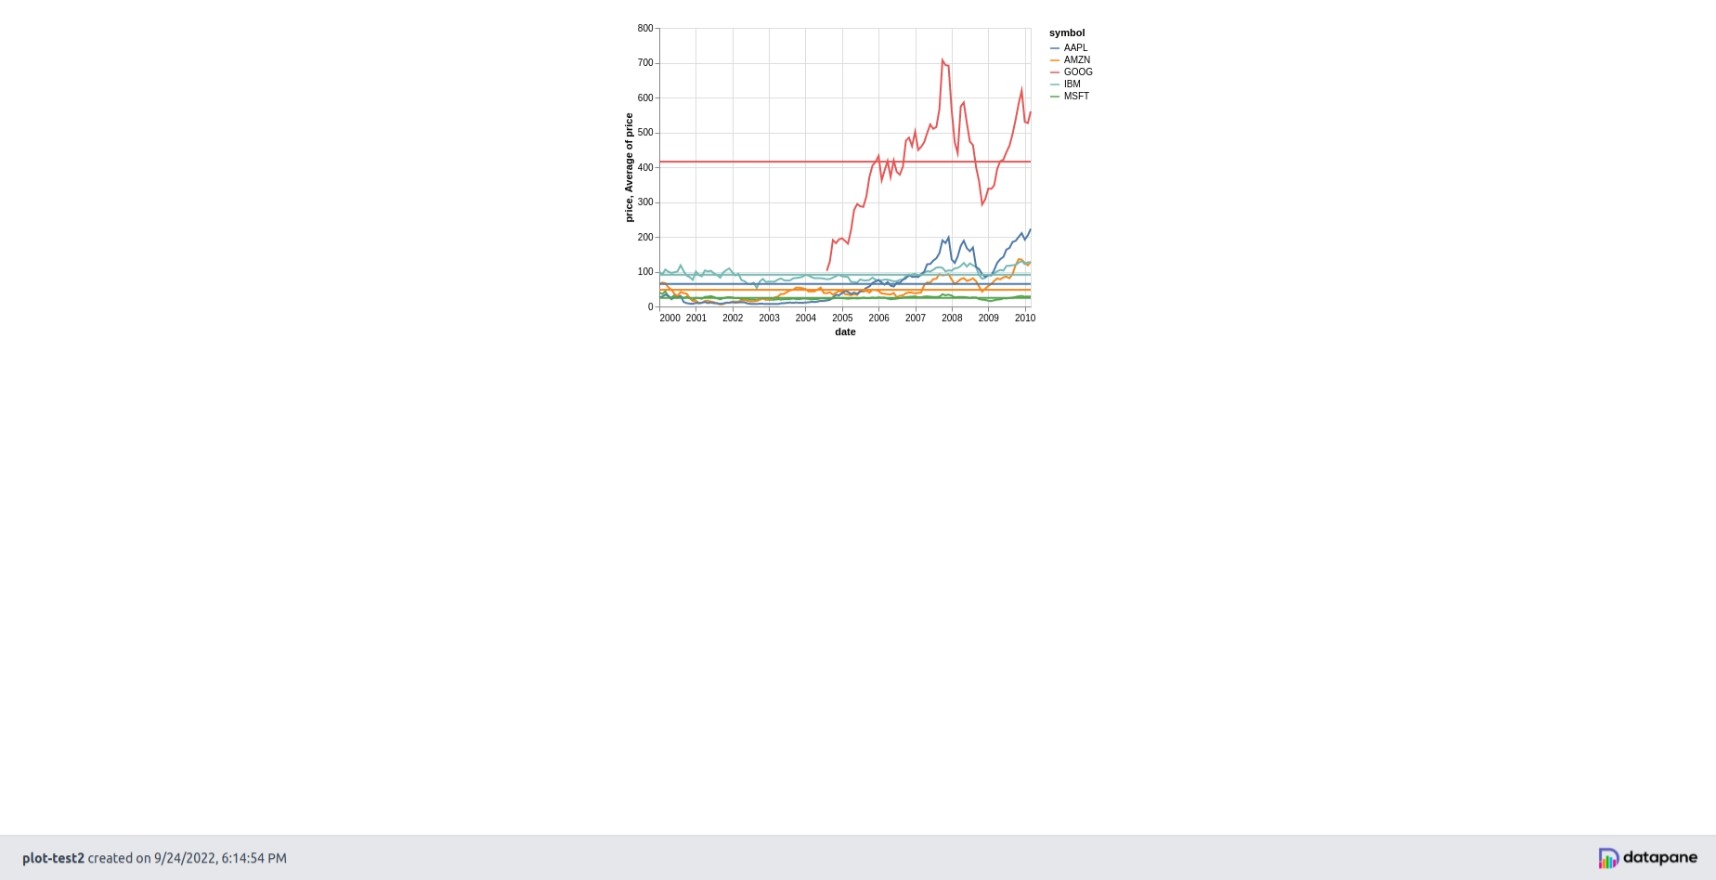
위와 같이 원래 도화지 크기로 Report가 생성되는 것을 볼 수 있다.
프로젝트를 작성할 때 이 정도의 Block들을 사용하였다. Block들의 종류는 많기도 하고, 계속 추가되고 있기 때문에 더 많은 종류의 Block들은 Datapane Docs를 확인하자.
4. Report Layout
Report 전체 너비와 Layout을 설정하는 법을 알아보자.
- Report 전체 크기
Report 너비를 설정하기 위해서는 dp.Report의 save 메서드에 formatting 인자에 ReportFormatting 클래스를 넣어주면 된다. 너비의 기본값은 MEDIUM이다.
import datapane as dp
import pandas as pd

df = pd.DataFrame(
                {
                    "col1": [1,2,3],
                    "col2": [4,5,6]
                })

df_block = dp.Table(df)
report = dp.Report(df_block)
report.save("full-test.html", formatting=dp.ReportFormatting(
        width=dp.ReportWidth.FULL,
    ))
report.save("medium-test.html", formatting=dp.ReportFormatting(
        width=dp.ReportWidth.MEDIUM,
    ))
report.save("narrow-test.html", formatting=dp.ReportFormatting(
        width=dp.ReportWidth.NARROW,
    ))
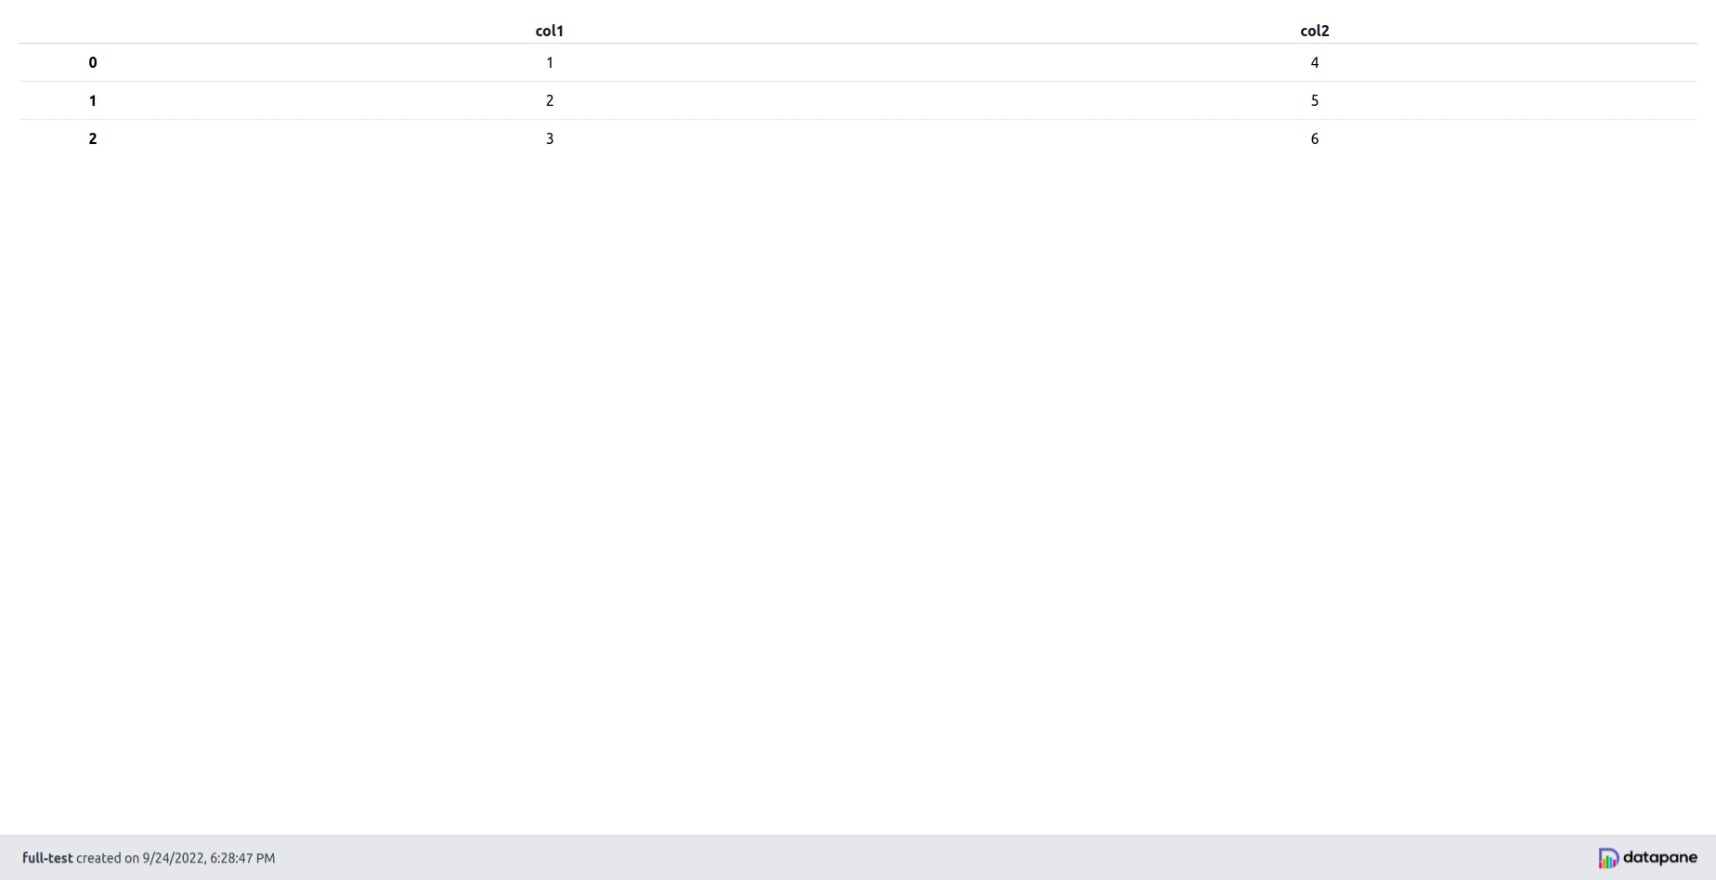
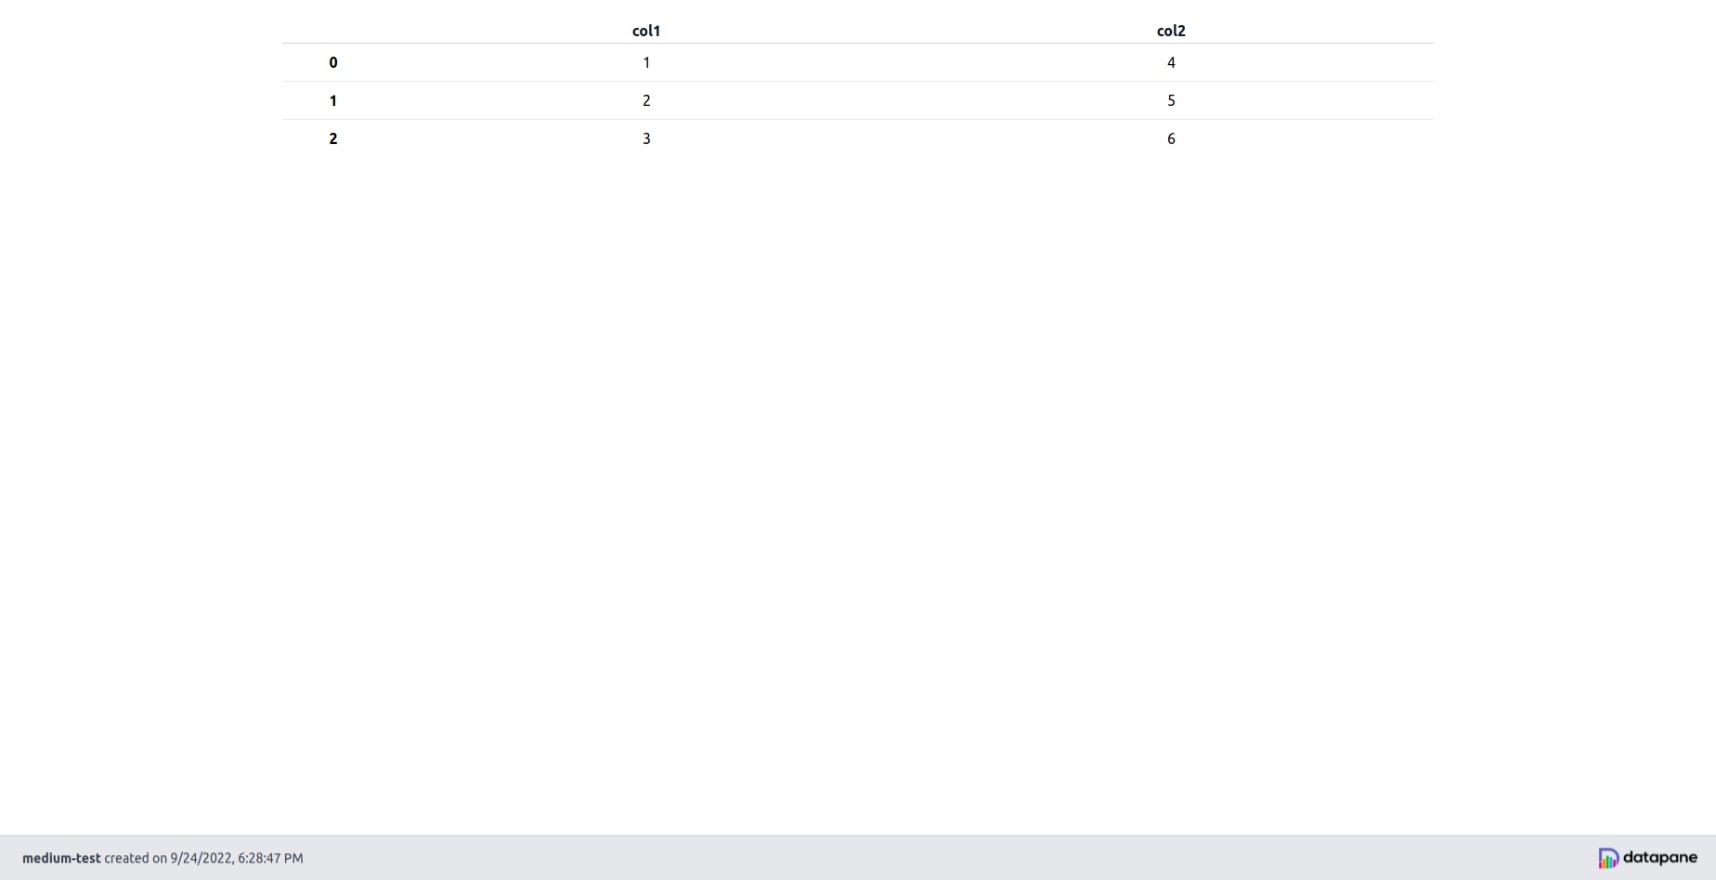

위와 같이 Report의 너비가 조절이 되는 것을 확인할 수 있다. 이외에도 다른 여러 옵션이 있으니 자세한 내용은 Datapane Styling을 확인하자.
- Report Layout
이제 Block들을 배치하는 법을 알아보자. Block들을 배치할 때는 dp.Group 클래스 안에 배치할 Block들을 넣는다.
import datapane as dp

text1 = dp.Text("Left Side")
text2 = dp.Text("Center Side")
text3 = dp.Text("Right Side")

group = dp.Group(text1, text2, text3, text1, text2, text3, columns=3)
report = dp.Report(group, text1, text2, text3)
report.save("group-test.html")
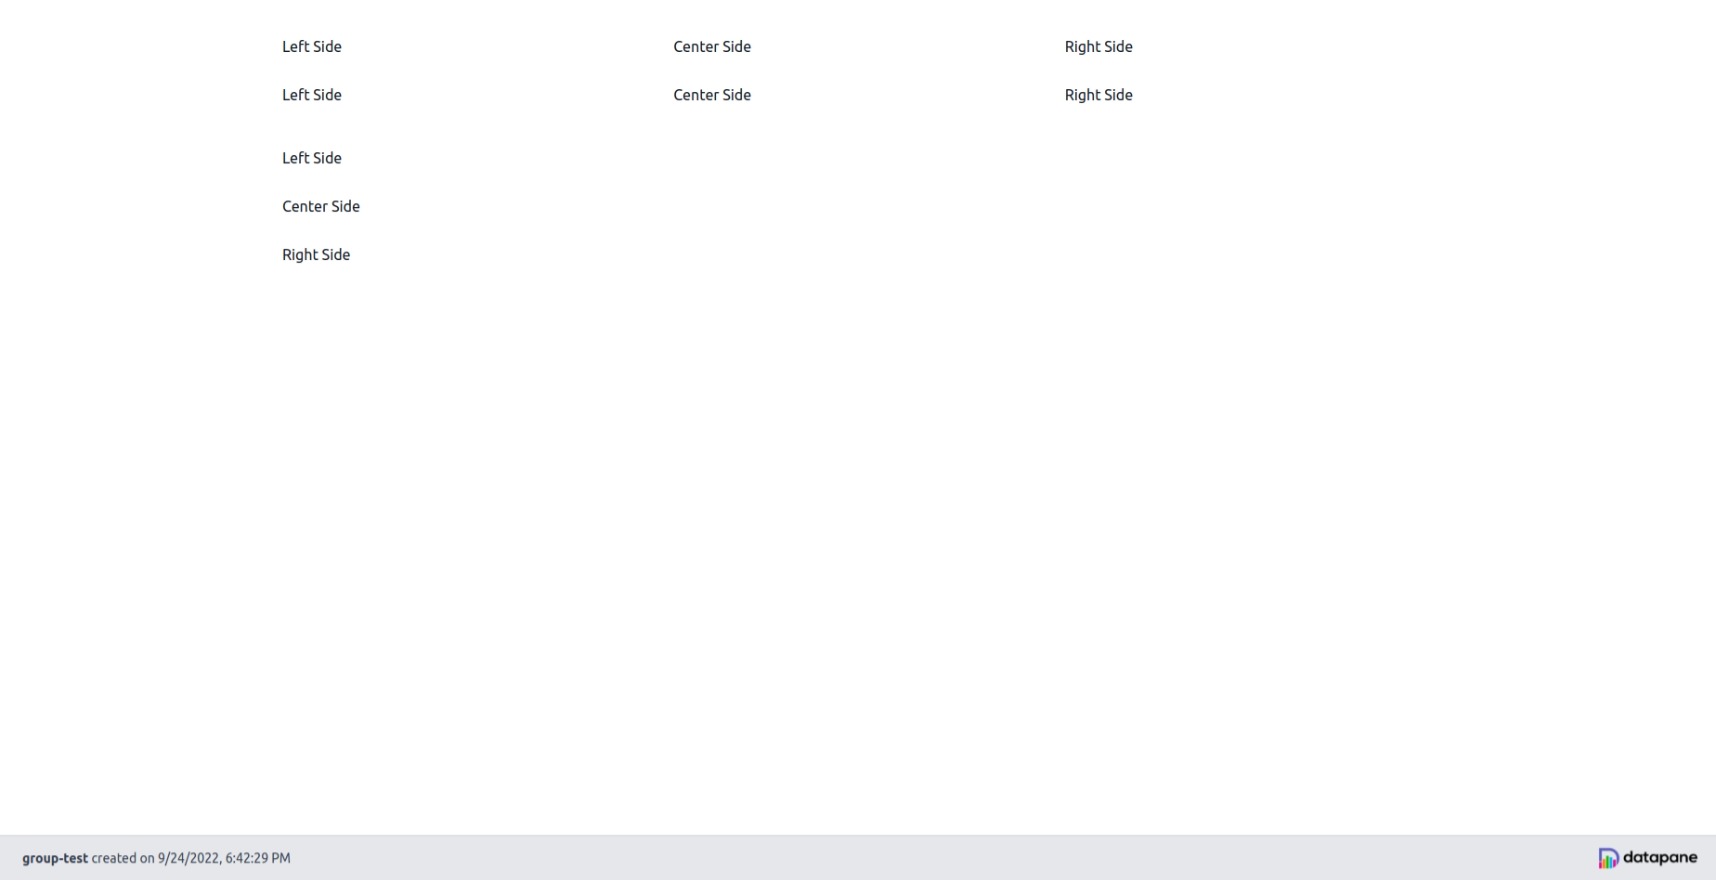
위와 같이 일반적으로 Report 클래스에 Block들을 넣으면 위에서 아래로 Block들을 배치하지만, Group 클래스 안에 Block들을 넣으면 왼쪽에서 오른쪽으로 Block들을 배치할 수 있다. 이 것을 조합하면 Block들을 원하는 대로 배치할 수 있다.
마치며
기본적인 Datapane 라이브러리의 사용법을 알아보았다. 사실 아주 기초적인 내용이라, 더 예쁜 Report 작성을 위해서는 Datapane Docs에서 자세한 내용을 보는 것을 추천한다. 더 신기한 내용들이 많다. 다음에는 Datapane으로 작성한 Report를 pdf로 변환하는 법을 쓸 예정이다.